How to uncover the most relevant trends

Get straight to what matters most for your business with our Trend Prioritization Algorithm.

1. Zero in on your challenge and target

Choose a question to see what really matters to your audience.

2. So what? Interpreting your results

This is your list of most relevant trends for your audience.

Trends at the top reveal your audience’s passion points where they show higher than average interest or participation, use these trends to tap into something distinct to them to grab their attention.

Trends in the middle show areas where they feel and participate similar to the average, they may still be very engaged in some of these behaviours but they are less unique to this group.

Trends at the bottom are where uptake and interest are lower than the average.

3. How strong are these signals?

Trends are dynamic, not static and it is useful to know how mature they are for your audience.

Trends that are emerging for your audience are new, think of them as weak signals of change or new behaviours gathering momentum. They’re perfect if you want to seem innovative or cutting edge.

Growing trends are a bit more established but are still rising for your audience, useful if you want to inspire a behaviour change and seem dynamic.

Finally established trends have become standard behaviour for your audience, they represent commonly held beliefs and behaviours and are good if you want to generate mass approval.

4. Digging deeper - how to use the trends

Select a trend to see how to activate it. We give you our expert recommentation and a global case study to inspire you to develop your own action plan for your business challenge.

Click learn more to access the full trend to understand the broader behaviour and to see the consumer needs driving it.

5. Interpreting the data behind your trends

Trends are big and made up of many behaviours and attitudes – check out the data to see everything that feeds this trend. We rank responses based on how passionate consumers are and how much they engage with it.

Our algorithm compares how your audience responds to this statement versus every other statement in our research to understand how they feel in comparison to everything else. So here you’ll see an index rather than an absolute score. Each data point shows your audience versus the average, so you can understand the specific areas where your customer really stands out.

6. I've found my priority trends - what now?

Once you’ve selected your priority trends you can pin them to a board. Whenever you visit Collision you can go straight to your priority trends to see what’s new. We track case studies and add new examples that have impressed us every day, so you can get a steady stream of fresh inspiration for how to activate your trends.

FAQs

Can I compare two markets?

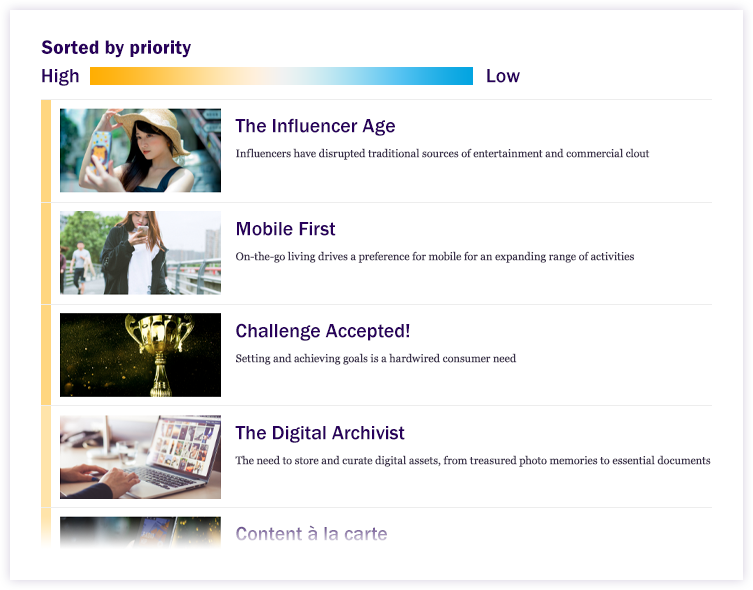
Yes – edit your comparison market to compare the two groups. At the top of your list you’ll see trends that are distinctive for your new audience, at the bottom you’ll find trends that are more relevant for your current audience. Explore the trends in the middle to find areas of common ground between the two audiences.

How do the filters work?

If you want to hone your list further, you can filter by your sector and your brand values. This won’t change the order of your list but will filter it to show trends that are relevant to both your audience and your sector / brand values.

Does the data show actual percentages of behaviours and interests?

No – our algorithm compares how your audience responds to this statement versus every other question in our research to give it a score of relative engagement and passion. The behaviour with the highest level of engagement from your audience would get a score of 100 and the lowest would get one.

What does it mean if a data point in in the top right quadrant?

When your audience appears in the top right quadrant, they are highly engaged. They participate highly and are passionate. The bottom right also shows engagement, but they’re less passionate, this behaviour could have become the norm. Top left shows low participation, but passion is high, this could be a newer, emerging behaviour. Bottom left shows low passion and participation.

Are all the questions in a trend equally important?

No – we give more importance to core behaviours and attitudes that we see as central to the trend and less importance to things that demonstrate how the trend manifests in a specific sector or area of life. You’ll often see varied questions spanning many sectors feeding into a trend as this helps us to build a broad picture of how a consumer really feels about something across many areas of their life.

What is intensity and participation?

Intensity is how we measure consumer passion – we look at how strongly consumers express interest in something new or agree with an attitude. Participation is how we measure behaviour – we look at uptake, as well as frequency of doing something. Trends are driven by a mix of passion and behaviour so we use both to measure our trends, though we put a slightly higher weight on behaviour.

Ready to see what really matters to you?

Are you currently looking for growth opportunities? Do you want to find out the quiet signals you’ve been missing? Or maybe you want to hone a campaign and make your marketing investment work harder?

Get straight to what matters with our algorithm.

Ask the algorithm
collision content card q1_c1 collision content card q1_c4
collision content card q2_c1 collision content card q2_c4
collision content card q3_c1 collision content card q3_c4
collision content card q1_c2 collision content card q1_c5
collision content card q2_c2 collision content card q2_c5
collision content card q3_c2 collision content card q3_c5
collision content card q1_c3 collision content card q1_c6
collision content card q2_c3 collision content card q2_c6
collision content card q3_c3 collision content card q3_c6